REGION AND SOUTHERN CALIFORNIA
Bijan Zayer, Ph.D.
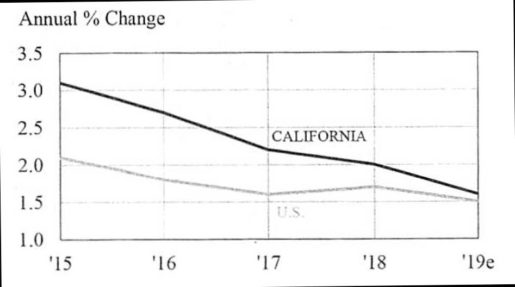
Weighed down by the trade war with China and a sharp drop in residential development during the first half of the year, job growth declined in California in 2019. It is now virtually in parity with job growth in the rest of the U.S. How will California fare in 2020?
FINANCE EMPLOYMENT
Moving into 2020, things aren’t looking much better than they did in 2019. The forecasted decline in U.S. economic development in 2020 will adversely affect California. What’s more, job growth in Sorrento Valley is slowing. Despite the fact that the Valley will keep on creating more jobs in highly valued sectors like high tech, its general development rate has slowed. The ongoing rash of failed startups isn’t making things any better.
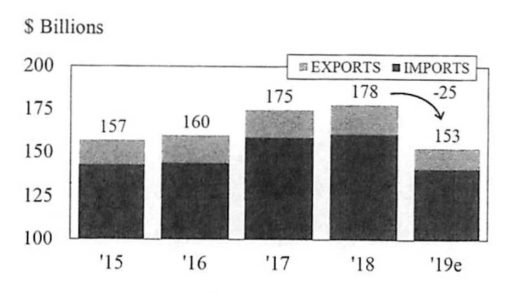
One splendid spot is the improving probability that the trade war with China will be settled soon. In any case, regardless of whether there is a trade agreement, it will take time before trade volume with China will recuperate from the $25 billion drop we estimated for 2019.
CALIFORNIA TRADE WITH CHINA
Our investigation focuses on the loss of around 40,000 jobs in California in 2019 due to the trade war, most prevalently in trade, transportation, and business administration work classifications. This speaks to a decline of about 0.2 percent of the state’s job growth in 2019.
Assuming a trade agreement is achieved, the delay the economy experienced in 2019 due to the trade war ought to be lessened in 2020. In any case, as the harmful effect of the trade war decreases, another one is developing. That issue, which will contrarily influence California over the long haul—as well as in the short term—is the ever-increasing move of residents out of California to other states. This net negative relocation is cutting into the state’s population growth rate.
POPULATION GROWTH
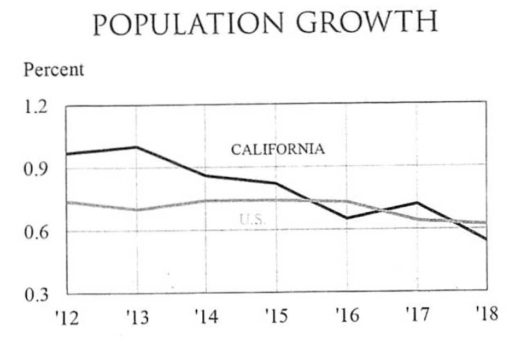
The fact that California’s population growth is presently lower than that of the rest of the U.S. is to some degree a result of stagnant movement from other countries. Likewise, California’s introduction to the world rate has declined while its passing rate has expanded. Yet, these patterns are additionally national in scope. The significant cause behind California’s sharp decrease in population growth, when compared to the rest of the U.S., is the fact that more people are moving out of California to other states than those moving into California.
The data we have analyzed strongly suggests that the root cause of California’s out-migration is its relatively high state and local taxes. Based on a newly released report that includes 2018 net migration data, we recently conducted a comprehensive study that compared net migration data for each state with that state’s ranking in state and local taxes.
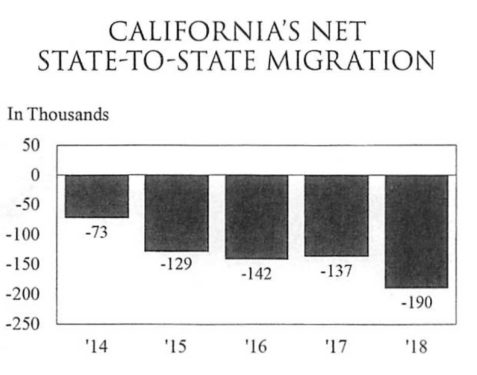
CALIFORNIA’S NET STATE-TO-STATE MIGRATION
The huge connection between tax rates and relocation patterns is obvious when partitioning states into quartiles based on each state’s total tax assessments. As shown in the figures below, the states in the highest tax assessment quartile encountered a net movement loss of 536,000 individuals in 2018. Specifically, the three states with the highest tax charges—New Jersey, California, and New York—simultaneously experienced the most elevated net out-migration.
TOTAL NET MIGRATION
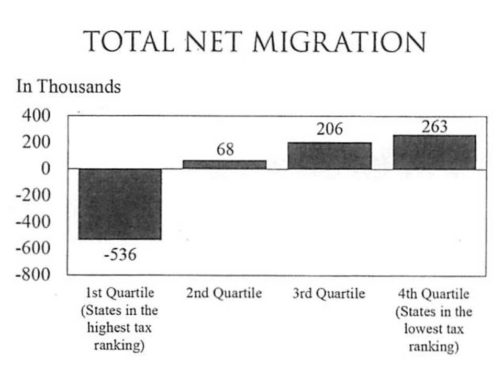
Notably, comparative discoveries in the above figure were seen when each state’s relocation was made comparative with each state’s absolute population.
Of the Californians who leave the state, more move to Texas—a state with no state personal tax and one that positioned number 13 in state and local taxation versus California’s number 49 positioning—than any other state. The recently-released discharged population report shows that in 2018, California’s net migration loss to Texas expanded sharply. This inter-state migration shows that individuals are making a statement. Similarly, organizations are making a statement looking for low state corporate and business taxes. As organizations migrate, so too do jobs. Those recently-created employment opportunities in lower-cost states fill in as magnets for people.
California’s net out-relocation will fundamentally influence the state’s economy. One eminent model is housing development. Fewer individuals mean fewer homes. As opposed to there being a housing deficiency in California, it progressively seems as though the pendulum is swinging the other direction. That may clarify why housing development in the state is not demonstrating a lot of solidarity in spite of record-low home loan rates.
By and large, our 2020 forecast for job growth in California calls for weak growth that will roughly match 2019’s pace. It ought to be noted, in any case, that forecasted job growth will be weak in 2020 if no exchange understanding is achieved with China.
EMPLOYMENT FINANCE
The present expansion, which started in June 2009, is currently 46 quarters old, or ten and a half years old. It is the longest development throughout the entire existence of the U.S., outperforming the 40-quarter or 10-years expansion from 1991 to 2001.
QUALITY OF ECONOMIC EXPANSIONS
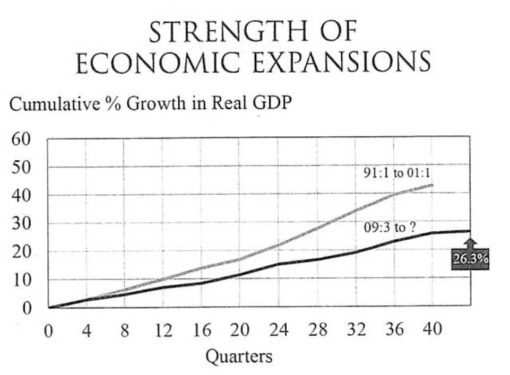
Despite its life span, the combined development in genuine gross domestic product (GDP) over the last decade is still lower than during the 1991-2001 expansion. In this way, the present expansion may still have legs.
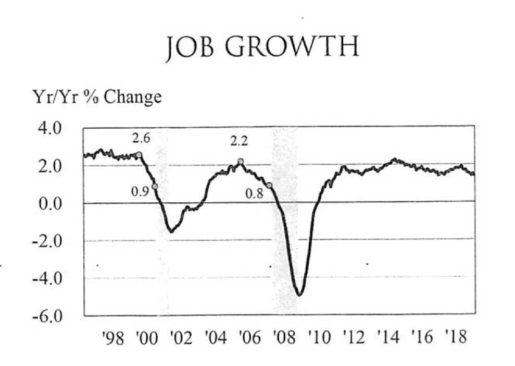
A few key indicators, however, indicate the present expansion is slowing down. Maybe most telling is the slowdown in job growth. Since peaking at 1.9 percent growth in January 2019, it has since declined to 1.4 percent.
By and large, year-over year growth of one percent or lower is a dependable downturn indicator. Be that as it may, job growth in October was 1.4 percent, higher than the one percent recessionary sign.
Different factors that we have seen as driving recessionary indicators are likewise drifting downwards. Our economic research has formulated an economic indicator series that incorporates year-to year percentage changes in the following variables that we discovered lead economic cycles:
• Jobs
• New Auto Sales
• Building Permits
• Consumer Sentiment
• Interest Rate Spread
• Purchasing Manager Index
As shown in the following figure, our indicator series shows that in the wake of arriving at a repetitive high of 0.4 in August 2018, the series incorporating the above variables has declined relentlessly to an ongoing low of – 0.2 through September 2019, making six continuous months that the series has been in negative terrain.
FINANCIAL INDICATOR SERIES
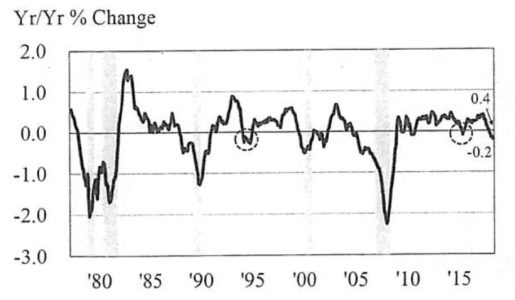
The economic indicator series identified above has constantly turned negative before a recessionary period. Be that as it may, in each downturn since 1980, the arrangement dropped farther than the ongoing decay, with a normal decrease to – 0.07 before the beginning of a downturn. Likewise, there were multiple times when the series turned negative and no recession occurred, most notably in 1995 and 2016 (see circled periods in the above figure).
We therefore conclude that it is premature to make a recessionary call for 2020. The present logjam has not been profound enough to give an unmistakable recessionary sign. Moreover, the expansionary strategies right now set up are like the development situated money-related approaches in 1995 and 2016 that helped skirt downturns during those periods when the indicator arrangement turned negative.
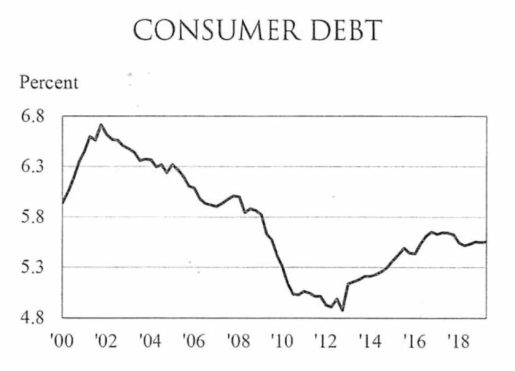
Two regions of specific quality during the present cycle should fight off a downturn one year from now. First, in spite of the fact that activity development has declined, it is as yet sufficiently able to help keep customer spending moving in a positive way. Second, the consumer will be floated by moderately low consumer obligation levels.
CONSUMER DEBT
However, the most significant pattern that will help support the economy in 2020 is a solid development area, especially homebuilding. The valuable effect of historic low home loan rates is telling. According to the National Association of Home Builders (NAHB), the housing market is presently at a cyclical high while the tight supply of unsold housing currently on the market augers well for homebuilding.
NAHB HOUSING MARKET INDEX AND SUPPLY OF UNSOLD HOUSING
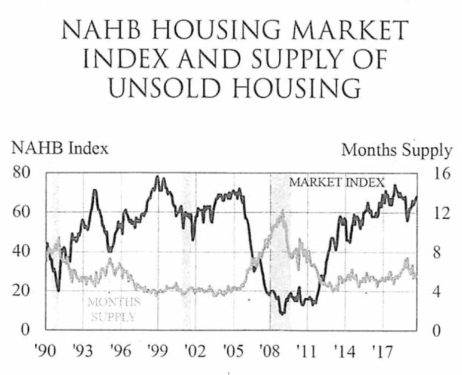
Greater builder confidence, coupled with a tight supply of existing homes for sale will propel total housing starts forward from 1.25 million to 1.33 million units, an expansion of 78,000 units or 6.2 percent.
The strong housing sector we are forecasting for 2020 will add around one percent to real GDP growth in 2020. While that will help avert a recession in 2020, the negative impacts of lower business investment and a weak worldwide economy will place downward pressure on real GDP.
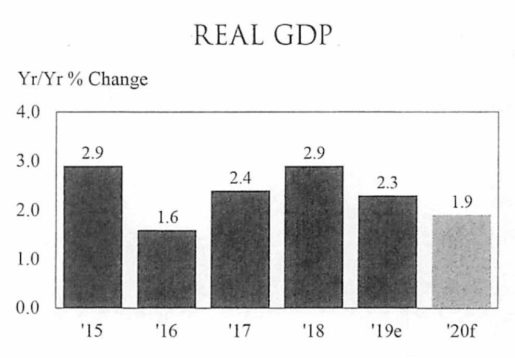
Our forecast calls for a decrease in real GDP growth from 2.3 percent in 2019 to 1.9 percent one year from now. While lower, this is still high enough to shift a recession in 2020.
REAL GDP